The tiniest logging stack: Fluent Bit, Parquet and DuckDB
A tiny logging stack for a tiny amount of logs, or more?
The often-recommended Loki can be quite heavy to set up and the highly available version has a complex architecture. I also tried Parseable which initially seemed simpler, though in the end it generated excessive traffic to and from S3 for my use case, with relatively slow query performance.
So what are our options for small environments, like a k3s cluster running on a few small nodes?
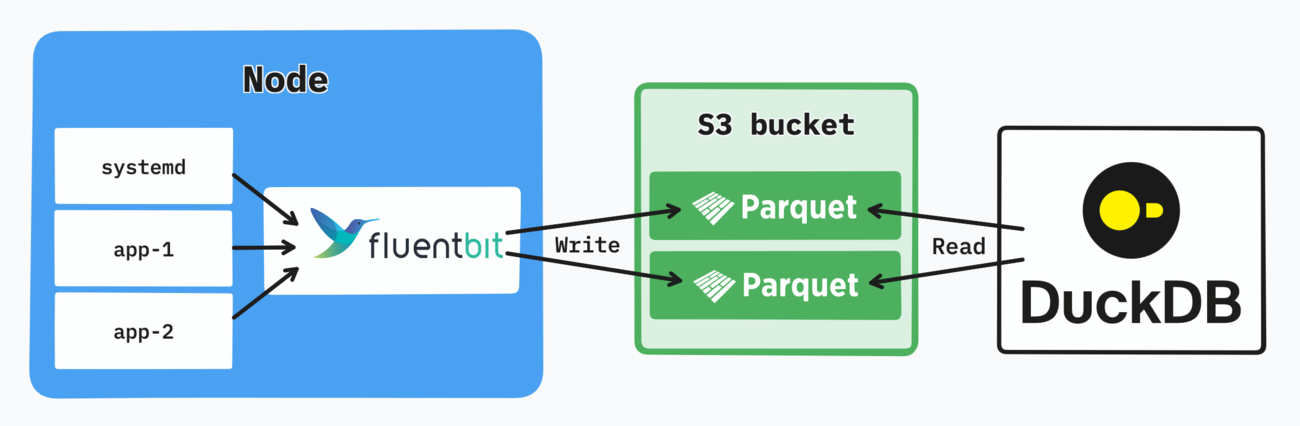
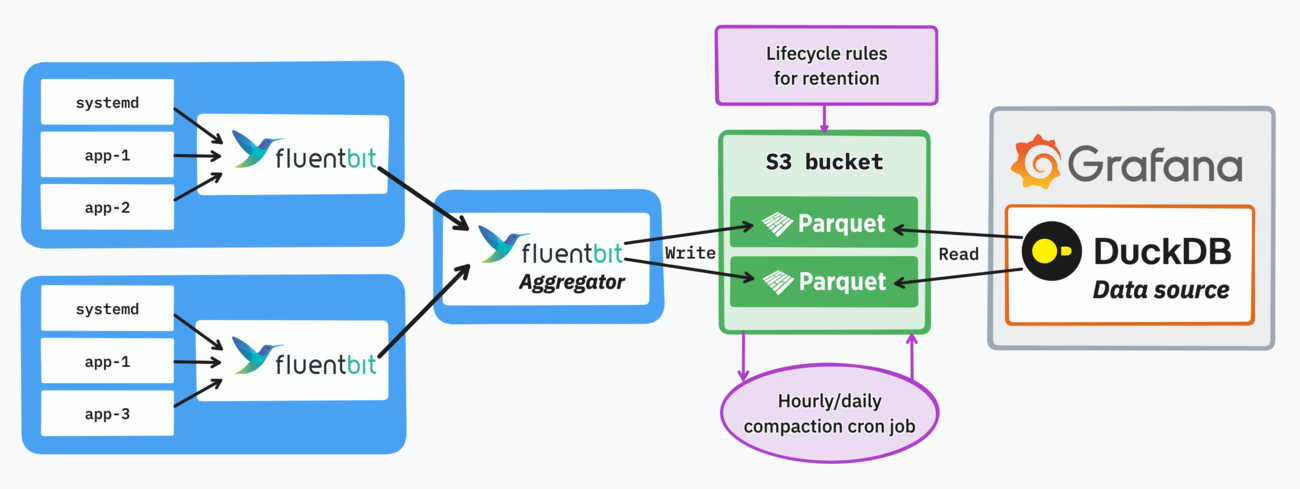
The tiniest logging stack.
Fluent Bit writes Parquet files into S3, DuckDB queries them. That’s it.
This is the tiniest logging stack that can aggregate logs, keep them in long-term storage, maintain good availability, and still scale to some extent.
For my 3-node setup the total memory footprint of Fluent Bit pods is under 100 MiB and CPU usage negligible. The object storage layer can be any S3-compatible alternative, like Scaleway in my case.
What’s in the diagram is technically all you need: Fluent Bit and an object storage bucket. However there are additional considerations to ensure a high query performance and plug a browsing interface in front of it.
Schema
Using Apache Parquet means you’ll need a schema. It’s better to keep it lean here as well, only defining the fields common to all logs.
For Kubernetes logs for example it could look like this:
time      timestamp
log       varchar
id        varchar
namespace varchar
pod       varchar
container varchar
node      varchar
logis the raw log as a JSON string, which can also be queried (non-optimally) from DuckDB via its JSON processing functions.idin this case is a UUID added by Fluent Bit (UUID_Key id), used later on for query-time deduplication.
Each log category might use a different schema, the important part here is to avoid mixing Parquet files with different schemas in a single query.
When updating the schema for a log category, you can also use union_by_name to perform a union over the fields in both schemas.
Too many (small) files
The core problem with each Fluent Bit daemon writing Parquet files to S3 is the sheer number of files this produces by default. Thousands of files can accumulate quickly and make any querying impossible in a reasonable amount of time.
Fortunately this can be greatly alleviated with some architectural patterns and appropriate configuration.
Partitioning
DuckDB supports Hive partitioning, which is the main step towards organizing our Parquet files and improving query performance.
The S3 output for Fluent Bit conveniently supports setting a matching key format:
s3_key_format /raw/containers/year=%Y/month=%m/day=%d/hour=%H/$UUID.parquet
Since the logs are always queried through a specific time window, time-based partitioning is the obvious choice here, with hourly partitioning being a good starting point. Using more dimensions (namespace, deployment…) would also make sense for larger volume use cases.
In this example containers is a log category. It’s not part of the partitioning as I consider each log category to possibly have a different schema, and thus the files shall not be mixed.
Only the necessary files will be read from S3 at query time, as DuckDB can perform partition pruning.
Buffering
By default the file count can still be fairly high within a given hourly partition. Buffering the logs for some time before writing them to S3 is the best way to address this issue.
For example we can configure Fluent Bit to only write files every 5 minutes, or when they reach a target size (whichever happens first):
Total_File_Size 5M
Upload_Timeout  5m
Note that Fluent Bit will do its best to flush the logs during clean shutdowns and not lose any logs even while buffering.
Buffering has of course implications on how soon you’ll be able to query new logs. An upload timeout of 5 minutes means logs can be delayed up to 5 minutes.
Aggregation
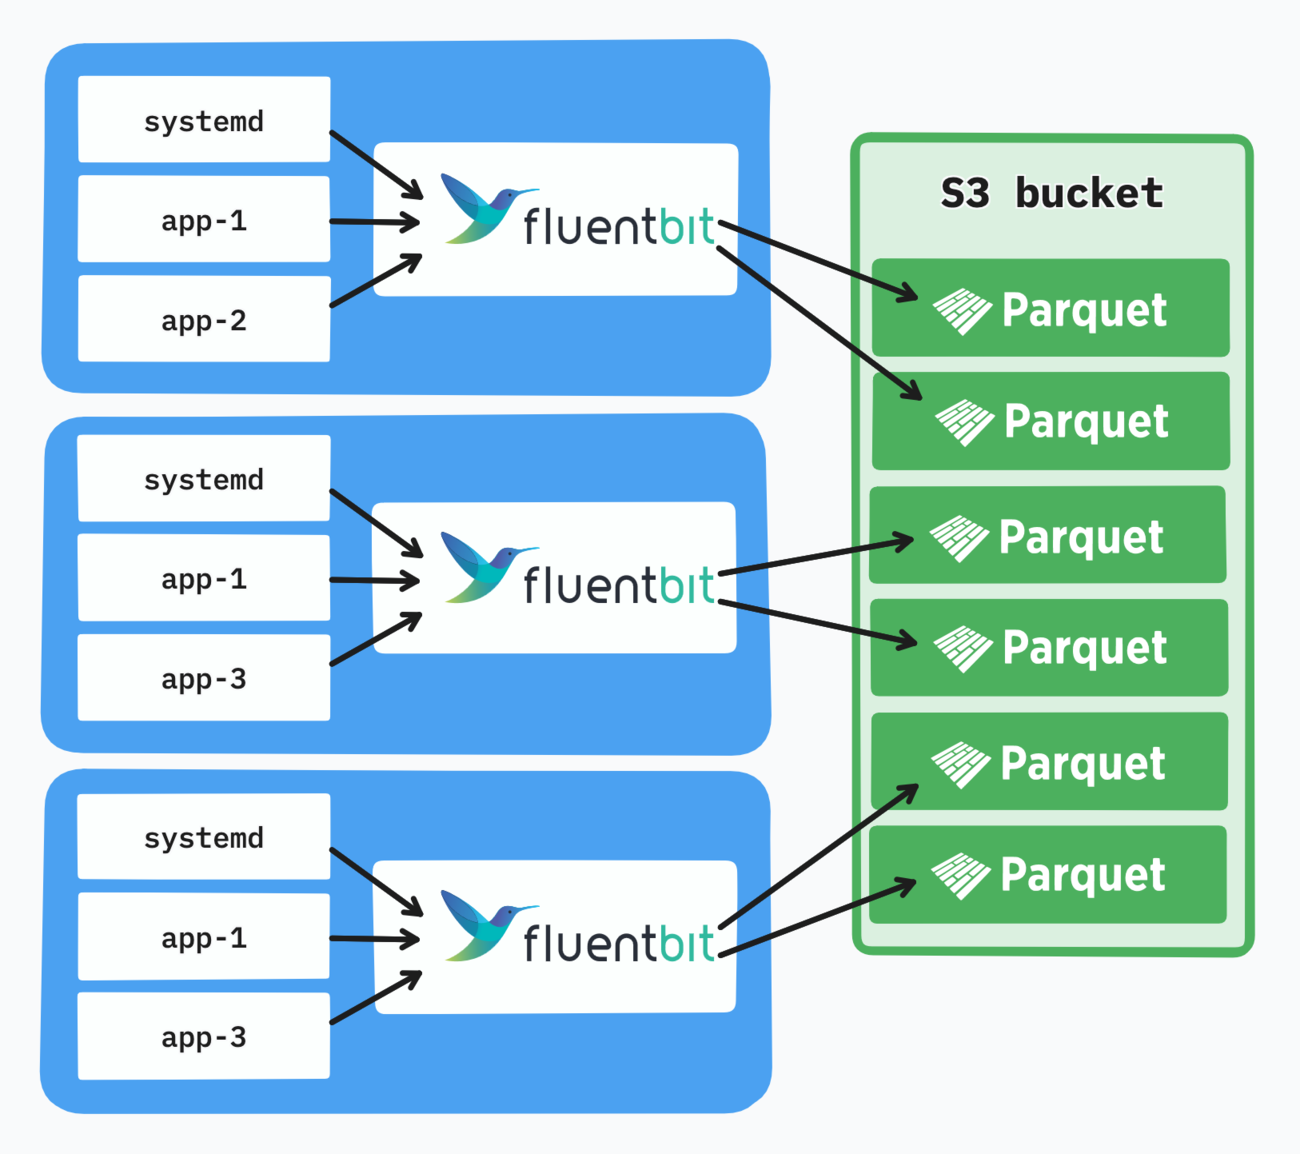
The small-file problem is amplified by the number of nodes you run: more nodes means more files, as each Fluent Bit daemon writes its own set.
A cleaner architectural solution can be achieved through Fluent Bit’s forward input and output. We can set up an aggregator deployment with a fixed number of pods, and have each daemon forward the logs to the aggregator service.
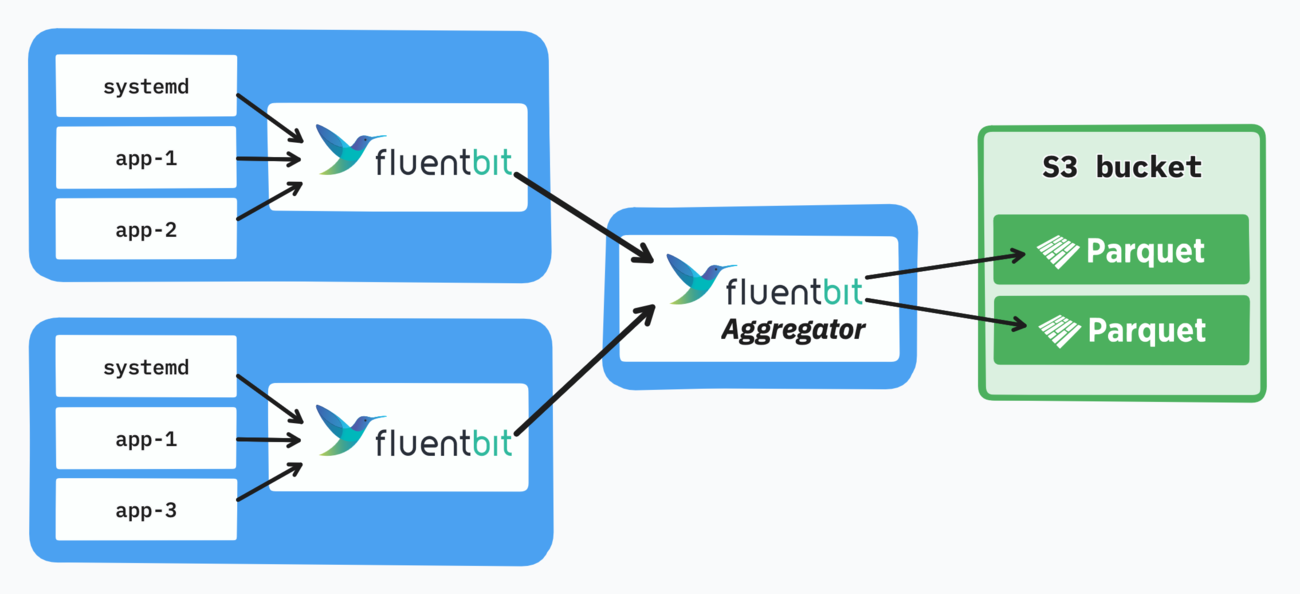
Even a single pod can be used for aggregation, as each daemon can also buffer logs for a while if the aggregator goes down for a short amount of time. Adequate monitoring can help ensure no logs are lost.
Ultimately the number of aggregator pods will also need to be balanced with the Parquet file size (e.g. 5-minute blocks), as these are the key parameters driving the number of files.
Compaction
Once we’ve finished writing log files to a given hour’s partition, we can compact them into a single Parquet file. This step is optional but helps in reducing the file count even more.
A lightweight hourly cron job running DuckDB can achieve this:
COPY (
    SELECT * FROM read_parquet(
        's3://{BUCKET}/raw/containers/year={y}/month={m}/day={d}/hour={h}/*.parquet',
        hive_partitioning=true,
        union_by_name=true
    )
) TO 's3://{BUCKET}/hourly/containers/year={y}/month={m}/day={d}/hour={h}/data.parquet' (FORMAT PARQUET);
To keep the bucket clean, raw files that were compacted should be deleted afterwards. In case raw and compacted files coexist for the same events, deduplicating by a unique id field comes in handy.
You can find the full compaction script I use on GitHub. It supports multiple log categories, hourly and daily compaction. Watermark files are used to keep track of the last successful compaction and to keep things idempotent.
About daily compaction, I wouldn’t recommend it (even though I use it): mixing partition levels is more difficult to reason about, daily files can get big and you rarely need to fetch a full day of logs at once.
Note that each compaction level also means increased traffic to and from your bucket, as all the logs need to be read and written again. The log volume and bandwidth costs are the main factors to consider here.
Lifecycle rules
Not really an optimization but still something to keep in mind: setting lifecycle rules in S3 defines your log retention. They can even transition objects between storage classes, useful if you keep a lot of logs and want to optimize storage costs.
Querying the logs
The idea of querying logs through SQL was a bit scary at first, but the reality is that you rarely need more than a few queries. It’s really about the tooling, such as a good browsing UI and taking advantage of DuckDB macros.
DuckDB data source for Grafana
If you already use Grafana for your metrics, using the DuckDB data source plugin is the easiest way to setup a log browsing UI. The native logs data source is not yet supported, though it’s not necessary for retrieving and browsing logs.
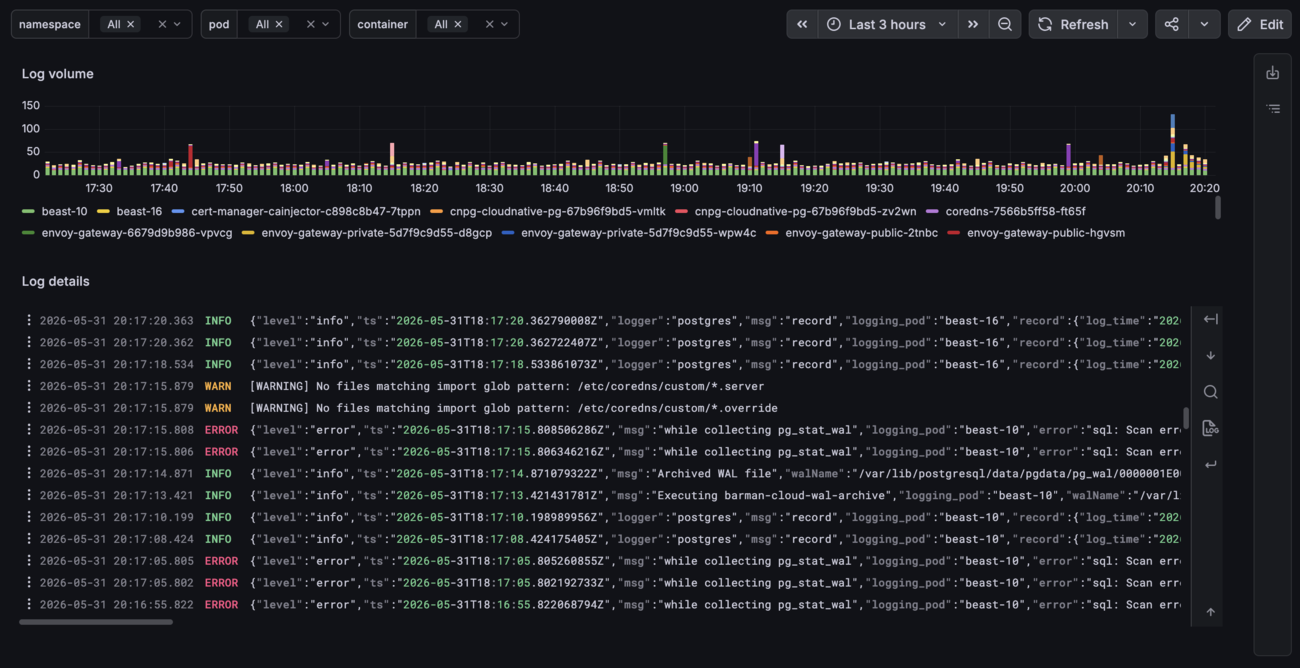
The logs panel type can be used to display and filter logs.
DuckDB will run within Grafana and read the Parquet files from S3. It also supports setting an init SQL which is very convenient to set up plugins, S3 authentication and macros.
This finally gives us our complete logging aggregation and browsing architecture:
Building the queries
Querying the logs efficiently with DuckDB is key to maintain a good browsing experience and make use of all the previous optimizations. Doing so while keeping the queries small within each panel is the main challenge.
The following macro does all the magic: it uses raw and hourly compacted files together, leverages partition pruning to read only the necessary files.
CREATE OR REPLACE MACRO logs(log_group, start_time, end_time) AS TABLE (
    SELECT
        * REPLACE (time::TIMESTAMP AS time)
    FROM read_parquet([
        's3://{BUCKET}/hourly/' || log_group || '/*/*/*/*/data.parquet',
        's3://{BUCKET}/raw/' || log_group || '/*/*/*/*/*.parquet'
    ], hive_partitioning = true, union_by_name = true)
    WHERE make_timestamp(year::BIGINT, month::BIGINT, day::BIGINT, hour::BIGINT, 0, 0)
            BETWEEN date_trunc('hour', start_time::TIMESTAMP) - INTERVAL 1 HOUR
                AND date_trunc('hour', end_time::TIMESTAMP) + INTERVAL 1 HOUR
      AND time::TIMESTAMP BETWEEN start_time::TIMESTAMP AND end_time::TIMESTAMP
    QUALIFY ROW_NUMBER() OVER (PARTITION BY id ORDER BY time::TIMESTAMP DESC) = 1
);
The 1-hour padding (INTERVAL 1 HOUR) ensures we don’t miss any logs if they got written in the previous or next hourly partition, which is a possibility with aggregation and buffering.
Deduplication on the id field is also necessary to avoid race conditions when querying as the compaction script is running, or if the raw log file deletion failed for any reason.
It’s not necessarily the most efficient query and can likely be optimized, though it now becomes trivial to filter logs for a specific time frame in Grafana:
SELECT time, log
FROM logs('containers', '${__from:date:iso}', '${__to:date:iso}')
ORDER BY time DESC;
As well as counting logs for graphs:
SELECT
    date_trunc('minute', time) AS time_minute,
    pod,
    COUNT(*) AS c
FROM logs('containers', '${__from:date:iso}', '${__to:date:iso}')
GROUP BY time_minute, pod
ORDER BY time_minute, pod;
Running EXPLAIN ANALYZE on the queries shows the Hive partition pruning in action:
Scanning Files: 10/26
Total Files Read: 10
The only remaining pain point is the count of object listing requests, for example #GET: 47 in the httpfs stats for the same query. This is due to the globbing with many wildcards and could be improved by restricting the paths to fetch.
Caching files
The biggest win for fast queries is using the cache_httpfs extension for DuckDB. It won’t make the first query faster but will cache Parquet files and make every subsequent query against the same files extremely fast, which happens often.
This is all you need to set it up:
INSTALL cache_httpfs FROM community;
LOAD cache_httpfs;

SET cache_httpfs_glob_cache_entry_timeout_millisec = 60000;
The cache_httpfs_glob_cache_entry_timeout_millisec value is important to set, as the globbed file paths from S3 are also cached. Without this value you would never see the newest Parquet files being added over time.
You can see the effect of the cache in this video, which shows how responsive log browsing is once the files have been cached:
Drawbacks
- For recent logs, the trade-off between the log delay and query performance is the biggest limitation. More complex compaction schemes could also deal with this issue.
- You rely on S3 (or similar) being available to ship and query your logs. Some setups like home servers might not even have any object storage available. In such cases you could consider writing to a persistent or network disk instead.
- This is not a plug-and-play solution, as it requires some tinkering to get started. Architecturally it still remains very simple and should run without much maintenance.
- Queries can likely be further optimized, for example expanding the exact partitions to be read instead of globbing many files and filtering afterwards. It’s a balance between ease of use and performance. This is not really a concern for low-volume use cases.
- The DuckDB data source plugin for Grafana could use some love, for example with native logs support and more frequent releases.
- Repartitioning (e.g. introducing more dimensions) could be needed as the log volume grows.
Extensions
Shipping logs as Parquet into S3 puts you in a good position for any future growth of your logging setup. This scheme is so common that it can be leveraged by many tools like ClickHouse, Athena, or Snowflake, where the data can be read from S3 directly.
Feel free to reach out if you run a similar architecture at a high scale, as I’m curious how much it can actually handle!
Links
You can find all my modules and configuration in my public Terraform registry:
- Grafana module including the DuckDB init SQL
- Fluent Bit module with the aggregator pattern and Kubernetes events collection.
Thoughts from readers